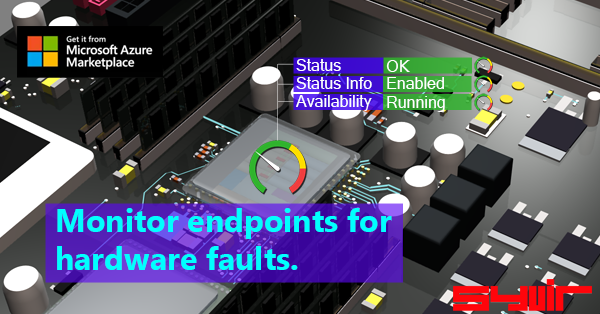
Syvir DM monitor endpoint hardware diagnostics...
Automatic scans of your PCs, Servers,Tablets, VMware, Hyper-V for hardware problems.

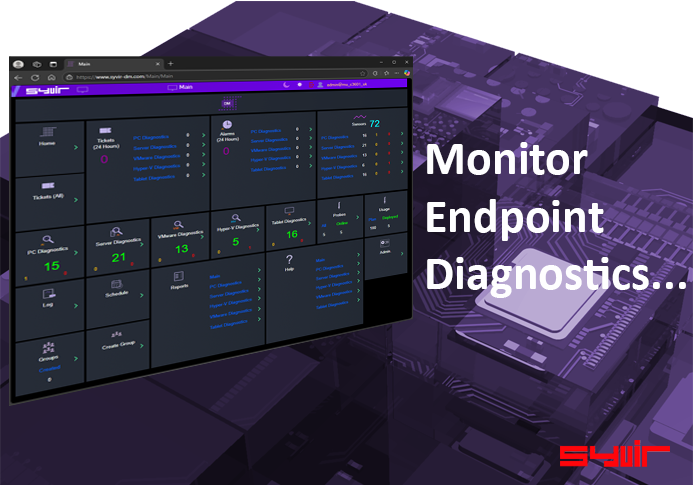
Syvir - Diagnostics Monitor is the easy way to find out if any of your endpoints have hardware issues. SYVIR - Diagnostics Monitor works through a Windows service on the target PC, Server, Tablet or virtual machine.
Endpoints are automatically scanned at hourly or longer intervals.
Syvir DM alerts you when it discovers a fault...
Data is transferred from the service probe to the SYVIR - Diagnostics Monitor cloud.
You can then view diagnostic data from the client machine.
Faults can be looked up with built in AI.
Produces spreadsheets reports on endpoints health.
SYVIR - Diagnostics Monitor gets to the problem fast with diagnostic information.
Pinpoints the issue.
Email diagnostic information to an engineer.
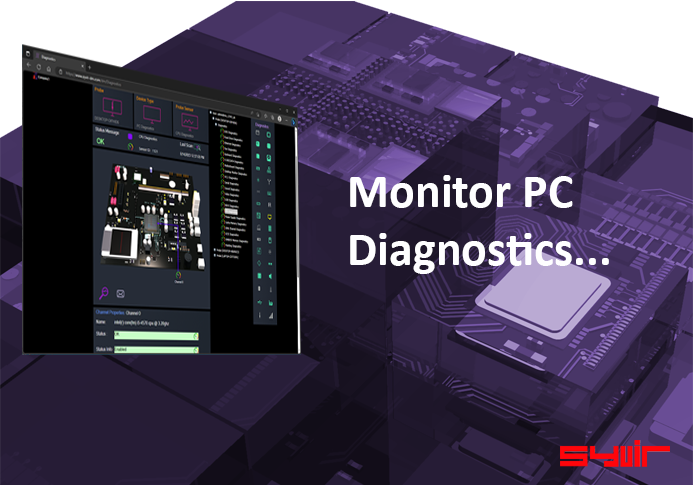
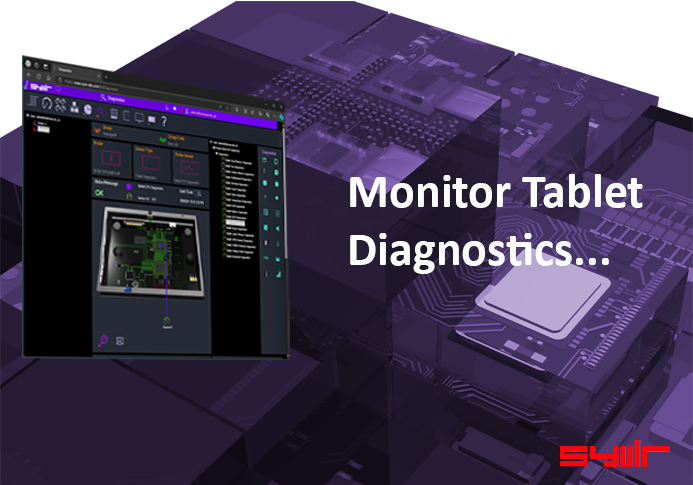
See real-time diagnostics information for your endpoints critical components so you can easily spot any hardware problems.
Easy to understand pricing.
Fits into your budget.
Syvir DM
Syvir DM
Syvir DM
Effective PC diagnostic monitoring in real time is to ensure key sensors are deployed to monitor critical endpoint components.
When you install a probe by default sensors are enabled on the system.
Some components such as hard drives are prone to failure and may impact you
more than say a pointing device breaking down.
Uses AI to provide further advice on specific problems.
Leverages AI to analyse diagnostic messages and return information on issues found.
As long as a diagnostic scan from SYVIR - Diagnostics Monitor probes reveal nothing, you can be safe in the knowledge that everything is running ok...
SaaS Cloud Software
© 2026 Syvir Technologies. All Right Reserved